Supplementary information for Altermatt et al. Methods in Ecology and Evolution. DOI: 10.1111/2041-210X.12312
“Big answers from small worlds: a user's guide for protist microcosms as a model system in ecology and evolution”
Altermatt F, Fronhofer EA, Garnier A, Giometto A, Hammes F, Klecka J, Legrand D, Mächler E, Massie TM, Pennekamp F, Plebani M, Pontarp M, Schtickzelle N, Thuillier V & Petchey OL
2.5 Measuring bacteria density: Flow cytometry
Introduction
Bacteria are the basic food resource for many protists, and commonly added in protist microcosm experiments (see section 1.3). However, in most studies bacteria have either been not or only crudely measured (e.g., using plating or optical density measurements), assuming that their dynamics are on a much faster scale than protist dynamics, and thus not limiting. This, however, may be oversimplifying (Fig. S1), especially as bacteria nowadays can be measured using flow cytometry (FCM) with at least at the same if not higher temporal resolution than protists. We thus postulate that ecologists using protist microcosm experiments should consider also measuring bacteria.
FCM has been used extensively in aquatic microbiology during the last decades, and the ongoing development of affordable and easy-to-use instrumentation has generalized the application thereof. FCM allows rapid quantification and characterization of suspended particles on single bacteria-cell level. The method is fast (\<1 min per sample), and thus enables high throughput measurements. The method is highly reproducible with a typical error of below 5% on replicate measurements. Moreover, FCM analysis of a sample usually measures several thousands of individual events, thus providing a strong statistical relevance for the obtained data. A FCM measurement collects multi-variable data for each particle, including light-scatter signals and fluorescence. The former is indicative of the size of the particles, while fluorescence is used in the simplest form for distinguishing bacteria from abiotic background. This is achieved through labelling the cells with a fluorescent dye such as SYBR Green or DAPI. Such staining can also provide information on the nucleic acid content of the bacteria, often related to the cell size. Finally, an array of fluorescent dyes exist that can be used to interrogate the bacterial sample with respect to activity and viability (Hammes & Egli 2010). The value of FCM comes from the use of highly defined staining and analysis protocols (Prest et al. 2013), resulting in a high reproducibility.
In the context of protist experiments, flow cytometric (FCM) analysis can be used to (1) accurately quantify the density of bacteria in a microcosm or similar experimental environment, and if required, (2) estimate the average cell size of bacteria. For this purpose, a set of experimental procedures is described, based on the work of Prest et al. (2013) and SLMB (2012). In recent protist experiments, FCM has been used to measure bacteria density (e.g., Limberger & Wickham 2011), however, we here give for the first time a detailed standardized protocol.
The described methods can be used on commercially available FCM instrumentation (discussed below). Standard laboratory safety precautions (e.g., protective clothing, gloves, etc.) are advised.
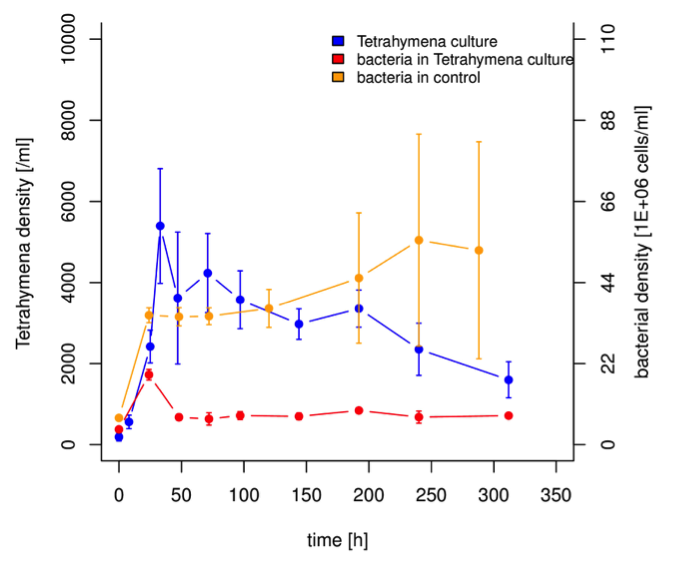
Figure S1. Density of Tetrahymena and a mixed bacteria culture (for bacteria used see Giometto et al. 2014) over 310 hours. Bacteria dynamics in the control are highly significantly different compared to bacteria dynamics in a Tetrahymena culture.
Materials
Equipment
-
A flow cytometer equipped with a 488 nm blue laser (>15 mW) and detectors for green fluorescence (520 ± 20 nm), red fluorescence (\< 610 nm) and high angle sideward scatter (90 °; SSC). The instrument is cleaned and calibrated according to the manufacturer’s procedures.
-
Sterile Eppendorf tubes (2 mL).
-
Heating block (37°C).
-
Pipettes and sterile tips.
Reagents
SYBR*® Green I working solution*
- Dilute SYBR® Green I (SG; Invitrogen) stock solution 100x in sterile filtered (0.1 μm; Millipore) dimethyl sulfoxid (DMSO) and store refrigerated (5 °C) until use (Prest et al. 2013). Alternatively, the SG dilution can be prepared with sterile TRIS buffer (10 mM, pH 8) (Hammes & Egli 2010).
Particle-free water/buffer for dilution
- Prepare particle-free dilution media by filtering (0.1 μm; Millipore) commercially available bottled mineral water (e.g., Evian®). Alternatively, sterile buffer (e.g., TRIS buffer, 10 mM, pH 8) can be used filtered similarly.
Procedure
Sample preparation
-
Collect the sample (1 mL) and homogenise by vortexing (10 sec).
-
Dilute the sample 100x (10 μL sample in 990 μL) in particle-free mineral water or buffer). The dilution step may be omitted if a low cell density (\< 107 cells/mL) is expected; a larger dilution may be used if needed.
-
Transfer 200 µL of the diluted sample into a labelled Eppendorf tube.
-
Warm for 3 min at 37 ± 2 °C in a heating block.
-
Add 2 µL of SYBR® Green I working solution. The volumes of the sample and stain may be altered, but a stain dilution of 100x should be maintained.
-
Vortex briefly and incubate in the dark for 10 min at 37 ± 2 °C.
-
Transfer just before measurement 50 µL of the stained sample into 450 µL of particle free water to achieve a 10-fold dilution. The volumes may be adapted for different instrument requirements. This final dilution may be omitted if the cell density is already low enough.
-
Vortex briefly and measure.
Flow cytomtric measurement
-
Load the sample in the FCM and measure.
-
Use a pre-prepared template for measuring bacteria.
-
The “trigger” or “threshold” should be set on green fluorescence, and the instrument set-up should be in such a manner as to allow visualisation of all cells stained with SYBR Green I. Specific instrument settings will differ between instruments, but an example is demonstrated in the “Expected Results” section below.
-
Visualise the sample on a two-dimensional density plot of green fluorescence (520 nm) and red fluorescence (>610 nm) and optionally a second two-dimensional plot of green fluorescence and sideward scattered (SSC) light.
-
Distinguish between bacterial cells and background with electronic gating.
-
Distinguish between small low nucleic acid (LNA) content bacteria and large high nucleic acid content (HNA) bacteria with electronic gating.
-
Extensive details on the FCM methodology are supplied in PREST and SLMB.
Timing
15 minutes for sample preparation, 2 minutes for measuring. Can be automated for high throughput measurements (see Van Nevel et al. 2013).
Troubleshooting (Tips and Tricks)
Cell concentrations:
Most commercial FCM instruments measure accurately in the range of 10’000 – 1’000’000 cells/mL. The method description included several dilution steps that should suffice to reach this range of cells. However, the dilution steps can be adapted if the required concentrations range is not reached.
Extensive details on the FCM methodology are supplied in Prest et al. (2013) and SLMB (2012).
Anticipated results
Figure 2 shows FCM density plots of a bacterial culture during a protist growth experiment. The bacteria were stained with SYBR Green I as described above and analyled at an appropriate dilution. Figure 2A shows the green and red fluorescence intensities (arbitrary units) of ca. 1500 bacterial cells in a clear cluster, separated from background and instrument noise with electronic gating. Figure 2B shows the forward and sideward scatter intensities of the same cells, which are indicative of cell size, again forming a relatively homogenous cluster.
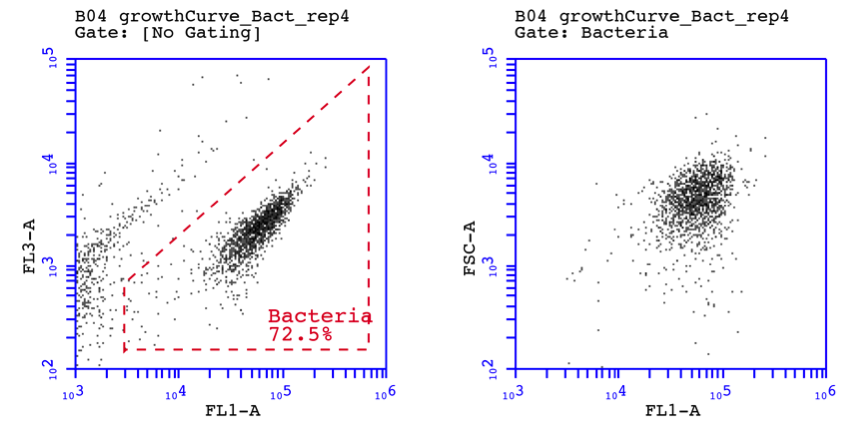
Figure 2. Flow cytometric density plots of an undefined bacterial community stained with SYBR Green I. FL1 = green fluorescence (530 nm); FL3 = red fluorescence (>610 nm); FSC = forward scatter; SSC = sideward scatter.
References
Giometto, A., Carrara, F., Rinaldo, A. & Altermatt, F. (2014) Emerging predictable features of replicated biological invasion fronts. Proceedings of the National Academy of Sciences, 111, 297-301.
Hammes, F. & Egli, T. (2010) Cytometric methods for measuring bacteria in water: advantages, pitfalls and applications. Analytical and Bioanalytical Chemistry, 397, 1083-1095.
Limberger, R. & Wickham, S. (2011) Competition-colonization trade-offs in a ciliate model community. Oecologia, 167, 723-732.
Prest, E.I., Hammes, F., Kötzsch, S., van Loosdrecht, M.C.M. & Vrouwenvelder, J.S. (2013) Monitoring microbiological changes in drinking water systems using a fast and reproducible flow cytometric method. Water Research, 47, 7131-7142.
SLMB (2012) Determining the total cell count and ratios of high and low nucleic acid content cells in freshwater using flow cytometry. Analysis method 333.1. The Swiss Food Codex (Schweizerische Lebensmittelbuch) (ed. S. Federal Office of Public Health).
Van Nevel, S., Koetzsch, S., Weilenmann, H.-U., Boon, N. & Hammes, F. (2013) Routine bacterial analysis with automated flow cytometry. Journal of Microbiological Methods, 94, 73-76.