Supplementary information for Altermatt et al. Methods in Ecology and Evolution. DOI: 10.1111/2041-210X.12312
“Big answers from small worlds: a user's guide for protist microcosms as a model system in ecology and evolution”
Altermatt F, Fronhofer EA, Garnier A, Giometto A, Hammes F, Klecka J, Legrand D, Mächler E, Massie TM, Pennekamp F, Plebani M, Pontarp M, Schtickzelle N, Thuillier V & Petchey OL
2.4 Particle counter
Introduction
We describe how to measure protist body size with the particle counter CASY Model TT Cell Counter and Analyzer, Roche® (in the following, simply CASY). We will use ‘cell size’ as a synonymous of body size, even though the method can also be used to measure body size of multicellular organisms (e.g., rotifer species). The CASY measures the volume of individuals via the Electrical Current Exclusion principle (please refer to the CASY user manual for in-depth description). The CASY allows measuring the body size distribution of ensembles of individuals and was found to resolve protists with typical linear size between 2 μm and 60 μm (according to specifications, the measurement range is 0.7 μm to 160 μm), both in isolation (Giometto et al. 2013) and assembled in multi-species communities (Mächler & Altermatt 2012). The typical measurement time is less than 60 s and requires the sampling of a volume between 100 μL and 4 mL, depending on cell density and size. If two or more species are present in the same sample, their body size distributions can only be discerned if they are non-overlapping. The CASY can process high cells densities and allows direct measurement of the cell volume with high resolution (512,000 measuring channels).
The instrument requires sampling of a typical volume between 100 μL and 4 mL; thus, if a non-invasive / destructive measure is required, alternative methods (e.g., digital imaging) are to be preferred. The CASY also allows measuring cell densities in user-defined size windows. The presence of debris in the sample, however, might result in imprecise counts; thus, alternative techniques (see sections 2.2 and 2.5) are recommended for measuring abundances.
The main limitation in the use of the CASY to measure protist size distributions relies on the low signal to noise (debris) ratio when the protist density is too low or the sample presents many impurities. The most common alternative method to measure protist body size is optical microscopy: digital images of individuals are recorded with a stereomicroscope equipped with a digital camera, cell lengths and widths are measured and volumes are calculated using known formulas for regular solids (e.g., a prolate spheroid). However, the imaging method is limited in the number of cells that can be processed in short times and relies on the calculation of 3-dimensional volumes from 2-dimensional images.
The use of the CASY is suggested when measurement of a large amount of individuals is needed or when the study species presents irregular cell shape (or a cell shape that is not a solid of revolution). An additional advantage of the CASY system is the possibility of measuring body size distributions of organisms that are too small to be observed with a stereomicroscope (e.g., Bodo saltans). Possible applications of the CASY include the study of cell size regulation and the plasticity of body size in the presence of predator/prey species or in different environmental conditions.
Materials
Equipment
The following equipment is needed for the measurement of protist body size distributions:
-
CASY Model TT Cell Counter and Analyzer.
-
CASY measuring capillary tubes. Available diameter sizes: 45 μm, 60 μm, 150 μm, 200 μm (the 200 μm capillary is currently out of production). The choice of capillary is related to the size spectrum of the sample. Capillaries can get clogged if the sample contains particles larger than the diameter of the capillary.
-
CASYcups. Measurement cups with lid.
-
Micropipettes to handle the sample and the CASYton (see Reagents).
Reagents
-
CASYton, an electrolyte used for cell suspension. The CASYton is used to dilute the sample below the maximum concentration processed by the CASY. We suggest filtering the CASYton with a 0.2 μm filter before use, to reduce debris counts. If the 45 μm capillary is used, CASYton should be de-gassed with an ultrasonic bath and a vacuum pump.
-
CASYclean: solution for the weekly cleaning of CASY (see user manual).
Procedure
The following procedure is advised for the measurement of body size distributions:
-
Switch on the CASY.
-
Check that the Waste Container is empty and fill the Storage container with clean CASYton.
-
Fit the desired capillary and the external electrode on the main unit.
-
Place a CASYcup with 10 mL of CASYton on the sample platform, with both the capillary and the external electrode in the solution.
-
Setup. Select the appropriate measuring setup under File - Setup Management and click Activate or manually change the measurement and display parameters in the Measure and Display menus. Refer to the user manual to save user defined measuring setups.
-
Background measurement. Perform a measurement to check the background counts. If the total counts are too high (> 100 counts/mL for the 150 μm, 200 μm measuring capillaries and > 200 counts/mL for the 60 μm capillary, refer to user manual for the 45 μm capillary), perform a 3x Clean cycle and replace the CASYcup with one containing clean CASYton. Repeat the measurement until the background is below the threshold. Please refer to the troubleshooting section or the user manual for typical errors displayed by the CASY in this step.
-
Sample preparation. Pipette 10 mL of CASYton in a clean CASYcup. Mix the sample and pipette the desired volume of the cell suspension in the CASYcup. Close the CASYcup with the provided lid and mix gently. The aliquot of sample depends on its concentration and the measuring capillary. Typical values are 1 mL of sample diluted in 10 mL of CASYton with the 150 μm and 200 μm measuring capillaries. Always prepare the sample just before performing the measurement.
-
Measurement. Place the CASYcup containing the cell suspension on the sample platform. Perform a measurement and visualise the body size distribution on screen (see Fig. 1). If the concentration of the sample is high enough, two peaks will appear on the CASY display: the leftmost peak is due to debris in the solution and (possibly) smaller organisms (which might be resolved using a smaller measuring capillary), while the rightmost peak (or peaks, if more than one species is present) is relative to the study species. Although the instrument measures cell volume, body size is displayed on screen in terms of the Equivalent Diameter, that is, the diameter of a cell assuming it is spherical. Please note that the Equivalent Diameter is generally smaller than what is commonly reported as a typical linear size, such as cell length; thus, reporting the cell volume instead of the Equivalent Diameter is suggested. In the Display - Analysis menu, cursors can be set to compute cell density, mean body size and other information. Note, however, that these calculations do not subtract the background due to the debris.
-
Exporting data and analysis. The measurement can be exported in TXT format and imported in the desired software for statistical analysis (e.g., R or Mathworks Matlab). Subtraction of the debris peak is required when the body size distribution of the study species overlaps with the debris peak. The debris peak is typically found to be exponentially decaying in the region adjacent to the viable cells peak. An exponential fit of the debris size distribution in such region allows the extraction of the species’ size distribution.
-
Fill a CASYcup with clean CASYton, place it in the sample platform and perform a Clean cycle.
-
To perform another measurement, repeat from step 7.
Please note that the above procedure is a typical one. Details of the measurement (e.g., number of cycles per measurement, volume per cycle, number of measurements per sample) depend on the concentration and body size distribution of the sample. Abundant organisms (e.g., density > 103 mL-1 and equivalent diameter > 10 μm with measuring capillary 150 μm and 200 μm) like Euglena gracilis (see Fig. S1a) are ideal for use with the CASY and one measurement per sample usually suffices to measure a smooth body size distribution. Less abundant species (e.g., density \< 103 mL-1 and equivalent diameter > 10 μm with measuring capillary 150 μm and 200 μm) like Euplotes aediculatus might require more than one measurement per sample to obtain a smooth size distribution (see Fig. S1b). When measuring samples containing multiple species, one might need to use different sized measuring capillaries to correctly resolve the whole community size distribution.
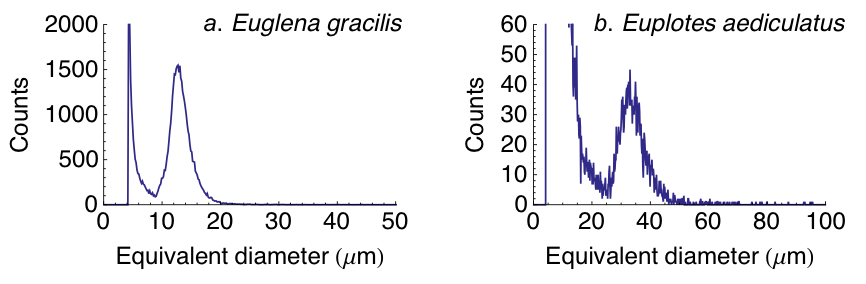 Fig. S1. Body size distributions measured with CASY: in each panel, the leftmost peak is the Debris peak and the rightmost peak is the peak relative to the study species. Straight lines join data points. a: Body size distribution (not normalized) of Euglena gracilis. Shown are the total counts in 3 measurements from the same sample with measured density 1.4 x 10⁴ mL-1 (measuring capillary: 200 μm, cycles: 12, measurement volume: 400 mL, dilution: 5). b: Body size distribution (not normalized) of Euplotes aediculatus. Shown are the total counts in 9 measurements from the same sample with measured density 300 mL-1 (measuring capillary: 200 μm, cycles: 12, measurement volume: 400 mL, dilution: 5).
Timing
The typical measurement time is 15 s to 60 s per sample, depending on the measuring capillary and the number of cycles. However, the identification of the proper dilution required and the necessity to perform several measurements per sample might increase considerably the processing time. The cleaning procedure (3x Clean cycle) lasts approximately 20 s. The change of measuring capillary takes approximately 1 min. The weekly cleaning takes at least 4 h.
Troubleshooting (Tips and Tricks)
| Step | Problem | Possible reason | Solution |
|---|---|---|---|
| Background measurement | Error message: |
*Concentration too high* | Impurities in the system | Place a CASYcup with clean CASYton on the sample platform and perform cleaning cycles until the counts are low |
| Measurement | Error message:
*Concentration too high* | The concentration of the sample is too high | Further dilute the sample or choose a larger capillary |
| Background measurement or Measurement | Error message:
*The measurement time is too short* | The wrong capillary is selected in the setup | Choose the correct measuring capillary in the setup |
| Background measurement or Measurement | Error message:
*Large air bubble detected* | Air bubble in the calibrated vertical tube | Remove the sample, place a CASYcup filled with clean CASYton and perform a cleaning cycle. If the error persists, perform a weekly cleaning cycle. Avoid the formation of bubbles or foam while mixing the CASYcup containing the cell suspension |
Important
Do not place the CASY in the proximity of strong electromagnetic or electrostatic fields, as this can strongly interfere with the measurements and result in erroneous counts (without giving a warning message). Typical devices that can generate such fields in laboratories are fluorescent lamps and water baths.
References
Giometto, A., Altermatt, F., Carrara, F., Maritan, A. & Rinaldo, A. (2013) Scaling body size fluctuations. Proceedings of the National Academy of Sciences, 110, 4646-4650.
Mächler, E. & Altermatt, F. (2012) Interaction of Species Traits and Environmental Disturbance Predicts Invasion Success of Aquatic Microorganisms. PLoS ONE, 7, e45400.